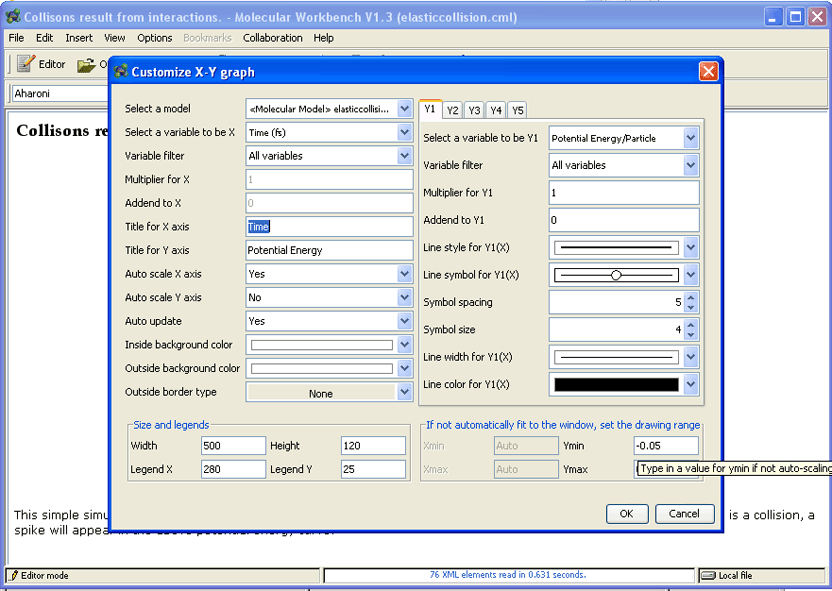
The outputs of a model can be shown using graphical and textual widgets that can be embedded in the page.
Data analysis of simulations can help users see what cannot be seen from the animation of ball-and-stick pictures. This is particularly important to the studies that depend on the calculations of statistical averages of certain mechanical properties to deliver crediable results that will help student learn. The following screenshot shows that the Molecular Workbench provides graphs that can be used to visualize the data produced in simulations.
